
In the field of machine learning, evaluating the performance of a classification model is of utmost importance. One popular evaluation metric that is commonly used is the AUC ROC Curve. The AUC-ROC curve provides valuable insights into the performance of a classifier, particularly in scenarios where the class distribution is imbalanced. In this article, we will delve into the details of the AUC-ROC curve and its significance in machine learning.
AUC ROC Curve machine learning
To comprehend the AUC-ROC curve, it is essential to understand its constituents. AUC stands for Area Under the Curve, while ROC represents Receiver Operating Characteristic. The ROC curve is a graphical representation that illustrates the performance of a binary classifier at different classification thresholds.
The TPR, also known as sensitivity or recall, is a measure of the classifier’s ability to correctly identify positive instances. On the other hand, the FPR is the ratio of false positives to the sum of false positives and true negatives. It measures the fraction of negative instances that are incorrectly classified as positive.
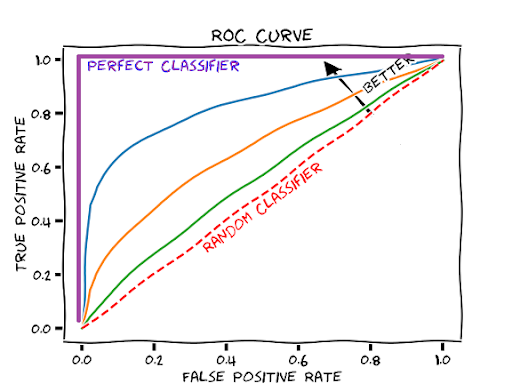
The AUC-ROC curve provides a comprehensive visualization of a classifier’s performance by showing how the TPR and FPR change with varying classification thresholds. The curve is constructed by calculating the TPR and FPR at multiple threshold values and connecting the points. The resulting curve ranges from the bottom-left corner (FPR = 0, TPR = 0) to the top-right corner (FPR = 1, TPR = 1).
The AUC is a numerical value that represents the area under the ROC curve. It quantifies the overall performance of the classifier by measuring the separability between the positive and negative classes. The AUC ranges from 0 to 1, where a value closer to 1 indicates better classification performance. An AUC of 0.5 suggests that the classifier’s performance is no better than random guessing.
The AUC-ROC curve provides several advantages. It is robust class imbalance. In situations where one class dominates the dataset, accuracy alone may not provide an accurate measure of the classifier’s performance. The AUC-ROC curve, however, considers the trade-off between true positives and false positives across different threshold values, providing a more comprehensive evaluation.
Secondly, the AUC-ROC curve is insensitive to the classification threshold. It considers the classifier’s performance at all possible thresholds, allowing for a more comprehensive analysis. This is particularly useful when the cost of false positives and false negatives varies and selecting an optimal threshold is crucial.
Furthermore, the AUC-ROC curve can be used to compare and select between different classifiers. When evaluating multiple models, the model with a higher AUC is generally considered to have better overall performance. This allows for an objective and quantitative comparison between different classifiers.
Final words
In conclusion, the AUC-ROC curve is a valuable tool for evaluating the performance of classification models in machine learning. By providing a visual representation of the classifier’s performance at different thresholds, it offers insights into the trade-off between true positives and false positives. The AUC, derived from the ROC curve, quantifies the overall performance of the classifier. Its robustness to class imbalance, insensitivity to classification thresholds, and ability to facilitate model comparison make it an essential metric in the machine learning toolbox. Understanding the AUC-ROC curve empowers data scientists to make informed decisions regarding the performance of their classification models.